Measuring the Success of Your Tokenization Marketing Campaign: Key Metrics and KPIs

Karolina

13 Jul 2023
Measuring the Success of Your Tokenization Marketing Campaign: Key Metrics and KPIs

As the world continues to swiftly adapt to blockchain technology, artificial intelligence, and cryptocurrency, the innovative idea of tokenization has come forward with the potential to profoundly transform various sectors. Tokenization involves representing tangible assets or rights within the digital realm via tokens on a blockchain. In order to effectively capitalize on tokenization's advantages, businesses must implement strong marketing campaigns that generate awareness, entice investors, and encourage widespread adoption.

Nonetheless, initiating a successful tokenization marketing campaign is merely the beginning. Companies need to assess their campaigns' success to gauge the efficacy of their tactics, refine future endeavors, and substantiate their worth to stakeholders. In this article, we aim to offer an exhaustive evaluation of critical metrics and key performance indicators (KPIs) that can be employed to determine a tokenization marketing campaign's success.

Throughout this article, various essential metrics and KPIs will be discussed in detail so as to assess the effectiveness of tokenization marketing campaigns. We will cover a range of indicators, from reach and engagement metrics to conversion rates and social media analytics. 

Essential Metrics for Evaluating the Effectiveness of a Tokenization Marketing Campaign

It is crucial to thoroughly examine essential metrics to determine the success of a tokenization marketing campaign. By monitoring and evaluating these metrics, businesses can determine their campaign's reach, engagement, conversion, influence on social media, and content performance. The following are the critical metrics to be considered when evaluating a tokenization marketing campaign's success:

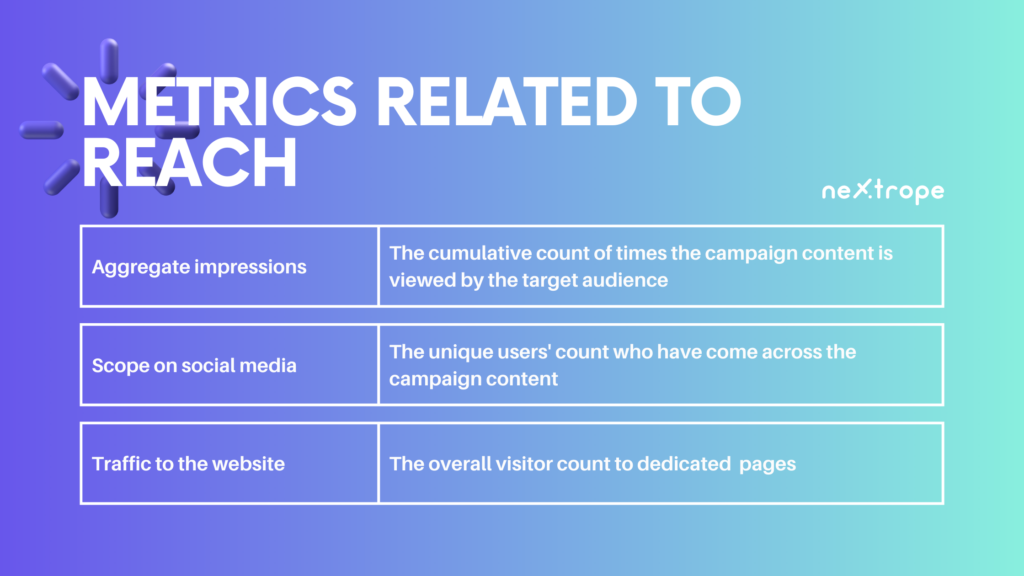
Metrics Related to Reach
Metrics Related to Reach

1. Aggregate impressions. The cumulative count of times the campaign content is viewed by the target audience through numerous channels like social media, websites, and advertising platforms.

2. Scope on social media. The unique users' count who have come across the campaign content on various social media platforms provides insights into visibility and possible audience size.

3. Traffic to the website. The overall visitor count to dedicated landing pages or websites for the campaign helps assess how effective it is in driving traffic and capturing interest.

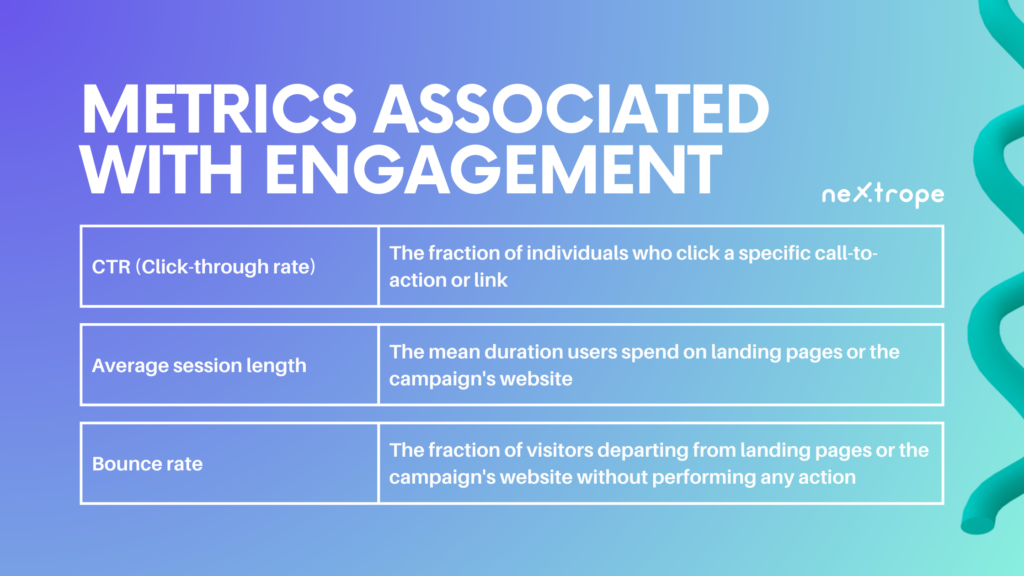
Metrics Associated with Engagement
Metrics Associated with Engagement

1. CTR (Click-through rate). The fraction of individuals who click a specific call-to-action or link within the campaign content gauges how effective it is in generating interest and encouraging engagement.

2. Average session length. The mean duration users spend on landing pages or the campaign's website indicates their engagement level and interest in the campaign.

3. Bounce rate. The fraction of visitors departing from landing pages or the campaign's website without performing any action implies issues with relevance or compelling content when higher.

Metrics Pertaining to Conversions
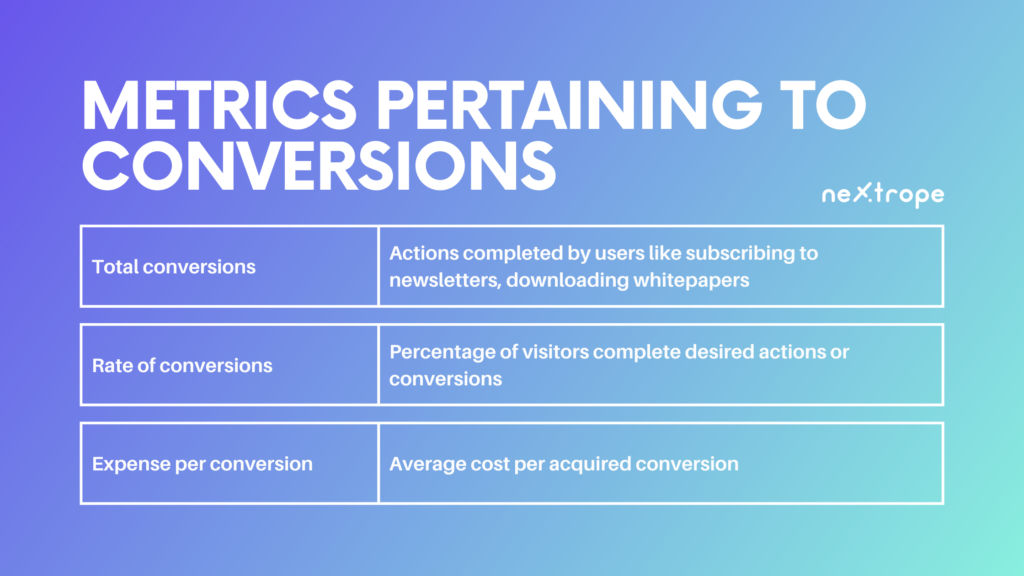
Metrics Pertaining to Conversions

1. Total conversions. Actions completed by users like subscribing to newsletters, downloading whitepapers, or making purchases indicate a campaign's capability in driving desired results.

2. Rate of conversions. A higher rate showing what percentage of visitors complete desired actions or conversions reflects a more effective campaign in persuading users.

3. Expense per conversion. Tracking average cost per acquired conversion assists in measuring campaign efficiency and cost-effectiveness for generating desired outcomes.

Metrics on Social Media
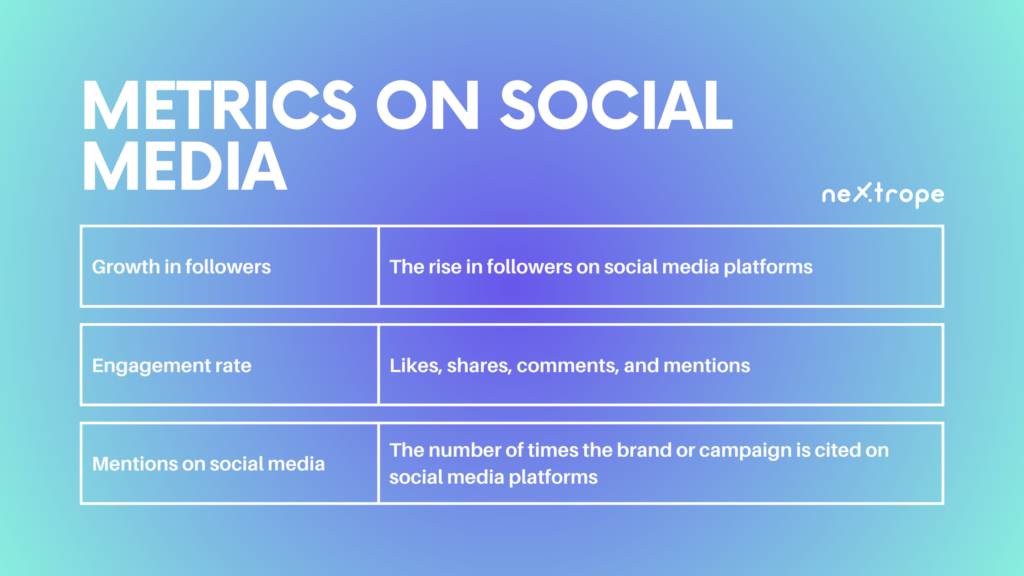
Metrics on Social Media

1. Growth in followers. The rise in followers on social media platforms during a campaign serves as a testament to its ability to appeal and engage audiences.

2. Engagement rate. Measuring user interactions with campaign content on social media platforms, such as likes, shares, comments, and mentions, demonstrates the campaign's success in resonating with audiences.

3. Mentions on social media. The number of times the brand or campaign is cited on social media platforms indicates its visibility, reach, and impact on respective channels.

Read our article about Leveraging Social Media

Content Metrics
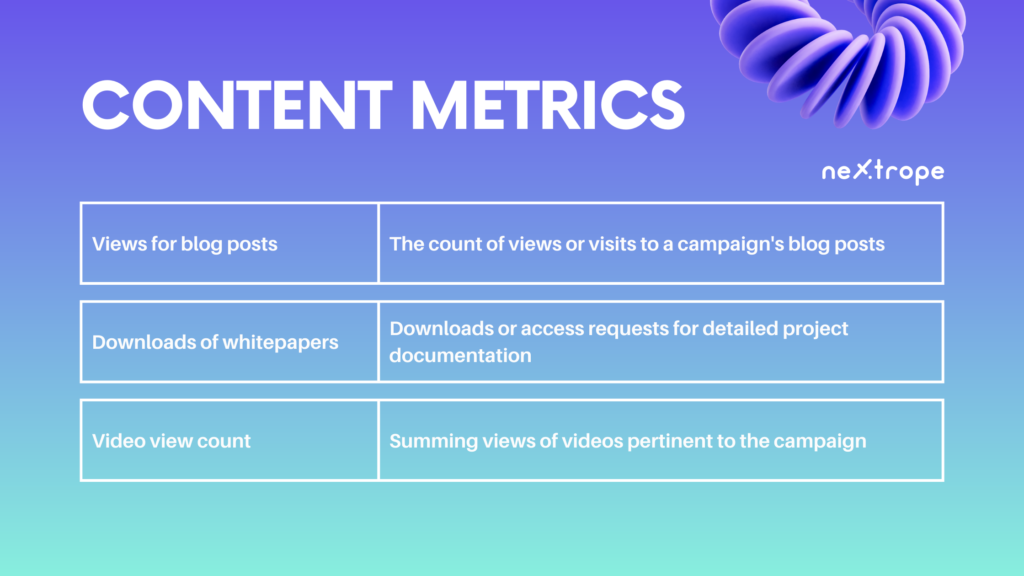
Content Metrics

1. Views for blog posts. The count of views or visits to a campaign's blog posts helps evaluate engagement and interest among potential investors or stakeholders.

2. Downloads of whitepapers. Quantifying downloads or access requests for detailed project documentation offers insights into a campaign's potential for generating interest from investors or stakeholders.

3. Video view count. Summing views of videos pertinent to the campaign reflects success in capturing audience curiosity and engagement.

By closely examining these crucial metrics, businesses can extract valuable information regarding their tokenization marketing campaigns' performance and effectiveness. Utilizing quantifiable data benefits decision-making, tactical optimization, and achieving objectives for the campaign.

Essential Key Performance Indicators (KPIs) for Evaluating the Effectiveness of a Tokenization Marketing Campaign

Key metrics offer specific data points to gauge the performance of a tokenization marketing campaign, whereas key performance indicators (KPIs) deliver a more comprehensive understanding of the campaign's overall effectiveness. KPIs enable the assessment of the campaign's influence on key business goals and supply valuable insights for informed strategic decisions. The following KPIs should be considered when evaluating the success of a tokenization marketing campaign:

Expansion in Token Holders

1. Quantity of new token holders. The aggregate number of new individuals or organizations that obtain and possess the token throughout the campaign. This demonstrates the campaign's capacity to attract new investors and broaden the token holder foundation.

2. Growth percentage of token holders. The percentage at which the number of token holders rises within a particular time frame. This demonstrates the campaign's competency in promoting adoption and enlarging the token's user base.

Market Capitalization

1. Overall market capitalization. The combined value of all tokens circulating during the campaign, arrived at by multiplying token price with total supply. It represents market value and general perception of the token.

2. Market capitalization growth rate. The percent increase in market capitalization for tokens over a specific period. This highlights the campaign's abilities to stimulate demand, elevate token value, and captivate investors.

Brand Awareness

1. Brand references in media. The frequency with which news articles, blogs, interviews, or other media platforms allude to the campaign or brand. This symbolizes the campaign's contributions toward elevating brand visibility and awareness.

2. Favorable sentiment in media coverage. The portion of media citations that express a positive perspective regarding the campaign or brand. It signifies the campaign’s efficacy in creating an agreeable public opinion.

Investor Confidence

1. Number of alliances or collaborations. The count of strategic alliances or collaborations formed during the campaign. This proves the campaign's capability to foster trust, draw respected partners, and boost investor confidence.

2. Increase in investment inquiries. The percentage growth in potential investors' inquiries or expressions of interest from institutions. This highlights the campaign's proficiency in seizing investor attention and producing investment prospects.

By scrutinizing these key performance indicators, companies can evaluate the overall success and impact of their tokenization marketing campaigns. These KPIs offer a comprehensive perspective on the campaign's performance, aligning with business targets such as investor growth, trading activity, market perception, brand visibility, and investor confidence. Utilizing these insights, businesses can fine-tune their strategies, pinpoint areas requiring enhancement, and achieve sustained success within the tokenization ecosystem.

Conclusion

It is essential for businesses aspiring to excel in the blockchain, AI, and cryptocurrency sectors to measure the success of their tokenization marketing campaigns. Assessing the reach, engagement, conversion, social media influence, and overall performance of campaigns can be achieved by employing key metrics and key performance indicators (KPIs). 

Valuable insights into campaign effectiveness can be obtained by examining metrics such as impressions, conversion rates, mentions on social media, and website traffic. Furthermore, KPIs like token holder growth, trading volume, market capitalization, brand awareness, and investor confidence offer a comprehensive understanding of the campaign's influence on vital business objectives.

Most viewed


Never miss a story

Stay updated about Nextrope news as it happens.

You are subscribed

Applying Game Theory in Token Design

Kajetan Olas

16 Apr 2024
Applying Game Theory in Token Design

Blockchain technology allows for aligning incentives among network participants by rewarding desired behaviors with tokens.
But there is more to it than simply fostering cooperation. Game theory allows for designing incentive-machines that can't be turned-off and resemble artificial life.

Emergent Optimization

Game theory provides a robust framework for analyzing strategic interactions with mathematical models, which is particularly useful in blockchain environments where multiple stakeholders interact within a set of predefined rules. By applying this framework to token systems, developers can design systems that influence the emergent behaviors of network participants. This ensures the stability and effectiveness of the ecosystem.

Bonding Curves

Bonding curves are tool used in token design to manage the relationship between price and token supply predictably. Essentially, a bonding curve is a mathematical curve that defines the price of a token based on its supply. The more tokens that are bought, the higher the price climbs, and vice versa. This model incentivizes early adoption and can help stabilize a token’s economy over time.

For example, a bonding curve could be designed to slow down price increases after certain milestones are reached, thus preventing speculative bubbles and encouraging steadier, more organic growth.

The Case of Bitcoin

Bitcoin’s design incorporates game theory, most notably through its consensus mechanism of proof-of-work (PoW). Its reward function optimizes for security (hashrate) by optimizing for maximum electricity usage. Therefore, optimizing for its legitimate goal of being secure also inadvertently optimizes for corrupting natural environment. Another emergent outcome of PoW is the creation of mining pools, that increase centralization.

The Paperclip Maximizer and the dangers of blockchain economy

What’s the connection between AI from the story and decentralized economies? Blockchain-based incentive systems also can’t be turned off. This means that if we design an incentive system that optimizes towards a wrong objective, we might be unable to change it. Bitcoin critics argue that the PoW consensus mechanism optimizes toward destroying planet Earth.

Layer 2 Solutions

Layer 2 solutions are built on the understanding that the security provided by this core kernel of certainty can be used as an anchor. This anchor then supports additional economic mechanisms that operate off the blockchain, extending the utility of public blockchains like Ethereum. These mechanisms include state channels, sidechains, or plasma, each offering a way to conduct transactions off-chain while still being able to refer back to the anchored security of the main chain if necessary.

Conceptual Example of State Channels

State channels allow participants to perform numerous transactions off-chain, with the blockchain serving as a backstop in case of disputes or malfeasance.

Consider two players, Alice and Bob, who want to play a game of tic-tac-toe with stakes in Ethereum. The naive approach would be to interact directly with a smart contract for every move, which would be slow and costly. Instead, they can use a state channel for their game.

  1. Opening the Channel: They start by deploying a "Judge" smart contract on Ethereum, which holds the 1 ETH wager. The contract knows the rules of the game and the identities of the players.
  2. Playing the Game: Alice and Bob play the game off-chain by signing each move as transactions, which are exchanged directly between them but not broadcast to the blockchain. Each transaction includes a nonce to ensure moves are kept in order.
  3. Closing the Channel: When the game ends, the final state (i.e., the sequence of moves) is sent to the Judge contract, which pays out the wager to the winner after confirming both parties agree on the outcome.

A threat stronger than the execution

If Bob tries to cheat by submitting an old state where he was winning, Alice can challenge this during a dispute period by submitting a newer signed state. The Judge contract can verify the authenticity and order of these states due to the nonces, ensuring the integrity of the game. Thus, the mere threat of execution (submitting the state to the blockchain and having the fraud exposed) secures the off-chain interactions.

Game Theory in Practice

Understanding the application of game theory within blockchain and token ecosystems requires a structured approach to analyzing how stakeholders interact, defining possible actions they can take, and understanding the causal relationships within the system. This structured analysis helps in creating effective strategies that ensure the system operates as intended.

Stakeholder Analysis

Identifying Stakeholders

The first step in applying game theory effectively is identifying all relevant stakeholders within the ecosystem. This includes direct participants such as users, miners, and developers but also external entities like regulators, potential attackers, and partner organizations. Understanding who the stakeholders are and what their interests and capabilities are is crucial for predicting how they might interact within the system.

Stakeholders in blockchain development for systems engineering

Assessing Incentives and Capabilities

Each stakeholder has different motivations and resources at their disposal. For instance, miners are motivated by block rewards and transaction fees, while users seek fast, secure, and cheap transactions. Clearly defining these incentives helps in predicting how changes to the system’s rules and parameters might influence their behaviors.

Defining Action Space

Possible Actions

The action space encompasses all possible decisions or strategies stakeholders can employ in response to the ecosystem's dynamics. For example, a miner might choose to increase computational power, a user might decide to hold or sell tokens, and a developer might propose changes to the protocol.

Artonomus, Github

Constraints and Opportunities

Understanding the constraints (such as economic costs, technological limitations, and regulatory frameworks) and opportunities (such as new technological advancements or changes in market demand) within which these actions take place is vital. This helps in modeling potential strategies stakeholders might adopt.

Artonomus, Github

Causal Relationships Diagram

Mapping Interactions

Creating a diagram that represents the causal relationships between different actions and outcomes within the ecosystem can illuminate how complex interactions unfold. This diagram helps in identifying which variables influence others and how they do so, making it easier to predict the outcomes of certain actions.

Artonomus, Github

Analyzing Impact

By examining the causal relationships, developers and system designers can identify critical leverage points where small changes could have significant impacts. This analysis is crucial for enhancing system stability and ensuring its efficiency.

Feedback Loops

Understanding feedback loops within a blockchain ecosystem is critical as they can significantly amplify or mitigate the effects of changes within the system. These loops can reinforce or counteract trends, leading to rapid growth or decline.

Reinforcing Loops

Reinforcing loops are feedback mechanisms that amplify the effects of a trend or action. For example, increased adoption of a blockchain platform can lead to more developers creating applications on it, which in turn leads to further adoption. This positive feedback loop can drive rapid growth and success.

Death Spiral

Conversely, a death spiral is a type of reinforcing loop that leads to negative outcomes. An example might be the increasing cost of transaction fees leading to decreased usage of the blockchain, which reduces the incentive for miners to secure the network, further decreasing system performance and user adoption. Identifying potential death spirals early is crucial for maintaining the ecosystem's health.

The Death Spiral: How Terra's Algorithmic Stablecoin Came Crashing Down
the-death-spiral-how-terras-algorithmic-stablecoin-came-crashing-down/, Forbes

Conclusion

The fundamental advantage of token-based systems is being able to reward desired behavior. To capitalize on that possibility, token engineers put careful attention into optimization and designing incentives for long-term growth.

FAQ

  1. What does game theory contribute to blockchain token design?
    • Game theory optimizes blockchain ecosystems by structuring incentives that reward desired behavior.
  2. How do bonding curves apply game theory to improve token economics?
    • Bonding curves set token pricing that adjusts with supply changes, strategically incentivizing early purchases and penalizing speculation.
  3. What benefits do Layer 2 solutions provide in the context of game theory?
    • Layer 2 solutions leverage game theory, by creating systems where the threat of reporting fraudulent behavior ensures honest participation.

Token Engineering Process

Kajetan Olas

13 Apr 2024
Token Engineering Process

Token Engineering is an emerging field that addresses the systematic design and engineering of blockchain-based tokens. It applies rigorous mathematical methods from the Complex Systems Engineering discipline to tokenomics design.

In this article, we will walk through the Token Engineering Process and break it down into three key stages. Discovery Phase, Design Phase, and Deployment Phase.

Discovery Phase of Token Engineering Process

The first stage of the token engineering process is the Discovery Phase. It focuses on constructing high-level business plans, defining objectives, and identifying problems to be solved. That phase is also the time when token engineers first define key stakeholders in the project.

Defining the Problem

This may seem counterintuitive. Why would we start with the problem when designing tokenomics? Shouldn’t we start with more down-to-earth matters like token supply? The answer is No. Tokens are a medium for creating and exchanging value within a project’s ecosystem. Since crypto projects draw their value from solving problems that can’t be solved through TradFi mechanisms, their tokenomics should reflect that. 

The industry standard, developed by McKinsey & Co. and adapted to token engineering purposes by Outlier Ventures, is structuring the problem through a logic tree, following MECE.
MECE stands for Mutually Exclusive, Collectively Exhaustive. Mutually Exclusive means that problems in the tree should not overlap. Collectively Exhaustive means that the tree should cover all issues.

In practice, the “Problem” should be replaced by a whole problem statement worksheet. The same will hold for some of the boxes.
A commonly used tool for designing these kinds of diagrams is the Miro whiteboard.

Identifying Stakeholders and Value Flows in Token Engineering

This part is about identifying all relevant actors in the ecosystem and how value flows between them. To illustrate what we mean let’s consider an example of NFT marketplace. In its case, relevant actors might be sellers, buyers, NFT creators, and a marketplace owner. Possible value flow when conducting a transaction might be: buyer gets rid of his tokens, seller gets some of them, marketplace owner gets some of them as fees, and NFT creators get some of them as royalties.

Incentive Mechanisms Canvas

The last part of what we consider to be in the Discovery Phase is filling the Incentive Mechanisms Canvas. After successfully identifying value flows in the previous stage, token engineers search for frictions to desired behaviors and point out the undesired behaviors. For example, friction to activity on an NFT marketplace might be respecting royalty fees by marketplace owners since it reduces value flowing to the seller.

source: https://www.canva.com/design/DAFDTNKsIJs/8Ky9EoJJI7p98qKLIu2XNw/view#7

Design Phase of Token Engineering Process

The second stage of the Token Engineering Process is the Design Phase in which you make use of high-level descriptions from the previous step to come up with a specific design of the project. This will include everything that can be usually found in crypto whitepapers (e.g. governance mechanisms, incentive mechanisms, token supply, etc). After finishing the design, token engineers should represent the whole value flow and transactional logic on detailed visual diagrams. These diagrams will be a basis for creating mathematical models in the Deployment Phase. 

Token Engineering Artonomous Design Diagram
Artonomous design diagram, source: Artonomous GitHub

Objective Function

Every crypto project has some objective. The objective can consist of many goals, such as decentralization or token price. The objective function is a mathematical function assigning weights to different factors that influence the main objective in the order of their importance. This function will be a reference for machine learning algorithms in the next steps. They will try to find quantitative parameters (e.g. network fees) that maximize the output of this function.
Modified Metcalfe’s Law can serve as an inspiration during that step. It’s a framework for valuing crypto projects, but we believe that after adjustments it can also be used in this context.

Deployment Phase of Token Engineering Process

The Deployment Phase is final, but also the most demanding step in the process. It involves the implementation of machine learning algorithms that test our assumptions and optimize quantitative parameters. Token Engineering draws from Nassim Taleb’s concept of Antifragility and extensively uses feedback loops to make a system that gains from arising shocks.

Agent-based Modelling 

In agent-based modeling, we describe a set of behaviors and goals displayed by each agent participating in the system (this is why previous steps focused so much on describing stakeholders). Each agent is controlled by an autonomous AI and continuously optimizes his strategy. He learns from his experience and can mimic the behavior of other agents if he finds it effective (Reinforced Learning). This approach allows for mimicking real users, who adapt their strategies with time. An example adaptive agent would be a cryptocurrency trader, who changes his trading strategy in response to experiencing a loss of money.

Monte Carlo Simulations

Token Engineers use the Monte Carlo method to simulate the consequences of various possible interactions while taking into account the probability of their occurrence. By running a large number of simulations it’s possible to stress-test the project in multiple scenarios and identify emergent risks.

Testnet Deployment

If possible, it's highly beneficial for projects to extend the testing phase even further by letting real users use the network. Idea is the same as in agent-based testing - continuous optimization based on provided metrics. Furthermore, in case the project considers airdropping its tokens, giving them to early users is a great strategy. Even though part of the activity will be disingenuine and airdrop-oriented, such strategy still works better than most.

Time Duration

Token engineering process may take from as little as 2 weeks to as much as 5 months. It depends on the project category (Layer 1 protocol will require more time, than a simple DApp), and security requirements. For example, a bank issuing its digital token will have a very low risk tolerance.

Required Skills for Token Engineering

Token engineering is a multidisciplinary field and requires a great amount of specialized knowledge. Key knowledge areas are:

  • Systems Engineering
  • Machine Learning
  • Market Research
  • Capital Markets
  • Current trends in Web3
  • Blockchain Engineering
  • Statistics

Summary

The token engineering process consists of 3 steps: Discovery Phase, Design Phase, and Deployment Phase. It’s utilized mostly by established blockchain projects, and financial institutions like the International Monetary Fund. Even though it’s a very resource-consuming process, we believe it’s worth it. Projects that went through scrupulous design and testing before launch are much more likely to receive VC funding and be in the 10% of crypto projects that survive the bear market. Going through that process also has a symbolic meaning - it shows that the project is long-term oriented.

If you're looking to create a robust tokenomics model and go through institutional-grade testing please reach out to contact@nextrope.com. Our team is ready to help you with the token engineering process and ensure your project’s resilience in the long term.

FAQ

What does token engineering process look like?

  • Token engineering process is conducted in a 3-step methodical fashion. This includes Discovery Phase, Design Phase, and Deployment Phase. Each of these stages should be tailored to the specific needs of a project.

Is token engineering meant only for big projects?

  • We recommend that even small projects go through a simplified design and optimization process. This increases community's trust and makes sure that the tokenomics doesn't have any obvious flaws.

How long does the token engineering process take?

  • It depends on the project and may range from 2 weeks to 5 months.